Showing posts with label Net exports. Show all posts

Thursday, 9 February 2017

German trade surplus and another mad Trump claim

Germany has posted a record trade surplus on its current account. This really means that Germany has exported more than it imported. It should be noted that both exports and import values grew, but export values grew faster.

Trade surpluses are not 'good' and deficits are not 'bad'. There should be a broad balance over time on the current account. If there are persistent deficits this suggests that a country will build up foreign debt and isn't competitive. A persistent surplus means that the Aggregate Demand in the economy is being boosted, leading to inflationary pressures and demand for the currency, to buy the exports, will force up the exchange rate.

Trump's trade advisor has accused Germany of using the weak value of the Euro to boost its exports. This bizarre claim is just another conspiracy theory. The value of the Euro is determined by the market and the European Central Bank (ECB) is independent of governments in setting monetary policy.

The claim does however allow us to realise that Germany is concerned to reduce its trade deficit because of the effect it has on the domestic economy. As pointed out in the article Germany has taken steps to boost domestic demand in order to stimulate demand for imports. Some of the measures are detailed in the article.

Not for the first time though the article demonstrates that the Trump administration is just batshit crazy.
The size of Germany's Current Account surplus compared to GDP for the last ten years, shows a growing issue.


This article is primarily of use to IB students in its detail. However the effects of a trade surplus and the effect of currency value is important knowledge for VCE students.

Wednesday, 1 February 2017

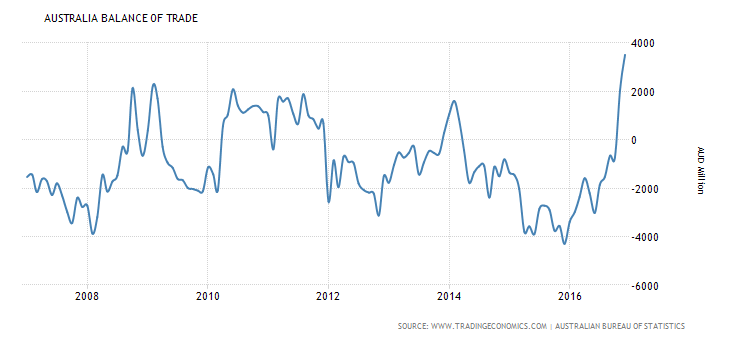
Australia posts record Balance of Trade surplus

It is a matter of some celebration that Australia has achieved its largest Balance of Trade surplus ever in December 2016. This means that the value of exports in goods and services was greater than the value of imports of goods and services. As shown in the graph below this is unusual for Australia.


The main reason for the boost is that the price of commodities has risen and so have the volume of exports. So Australia has exported more and got more for what they have sold. Chinese demand is crucial in this process.

There are other reasons for the improvement, one being the increased competitiveness of Australian goods and services due to the lower value of the dollar in recent years. However it is mainly commodities and that really is down to China.

Don't get too excited because the Australian Current Account remains in deficit and has been since 1974. The Current Account includes the Balance of Trade, net income and transfers. This clearly implies that the deficit on income and transfers outweighs the Balance of Trade surplus. The graph below shows the Current Account balance for the last ten years to compare with the Balance of Trade above (note that the data for last three months are not yet available below).
There are always implications for of Current Account deficit, such as the effect on Aggregate Demand, a Financial Account surplus, rising foreign debt and the possibility that the country is uncompetitive. A 43 year Current Account deficit suggests the competitivness point has been settled.


This topic is a crucial one for VCE students who should consider the impact on Australia's Net Foreign Debt position and what it says about the country's dependence on China and commodities. IB students will equally be able to use it as an example of International Trade and the wider effects of deficits and surpluses.

Thursday, 12 January 2017

Look out for the 'J curve'

Economic theory tells us that when a countries currency depreciates (falls in value) that export prices fall, import prices rise and that following the law of demand the level of net exports, X - M, (the balance of trade or current account) will grow.

It's not quite as simple as that. Firstly it takes time for the change in export and import volumes to occur. At first they will stay the same. This means at first export values stay the same (valued in the country's currency) and import values rise (values in the country's currency). So the balance of trade, or current account or net exports at first gets worse.

Providing the Marshall-Lerner conditions hold over time exports grow as foreigners realize they are now cheaper and imports fall as domestic customers switch to home produced alternatives. Therefore the reaction of net exports should be to initially worsen, then improve, and when plotted against time this looks like a 'J'.
Following the Brexit vote the value of the British pound fell, up to 20%. Therefore we might expect to see a J-curve effect on the British trade balance.

The data does not yet show this clearly. One reason is that the effect from t1 in the diagram above to the point where the current account turns into a surplus is thought to be about a year and a half. As we are six months in to the process we should only have seen a worsening of the trade balance so far.
UK Balance of trade December 2015 to November 2016 (latest data available in Jan 17)
The data shows the initial worsening we would expect in the balance of trade after the late June vote and fall in the pounds value. This isn't a smooth J-curve though.

The reason that we don't see a textbook J-curve is because all variables don't stay the same. In 1967 the UK devalued the pound in a fixed exchange rate system from 1:US$2.8 to 1:US$2.4. And that rate remained fixed until 1971. Therefore there was certainty and stability in the exchange rate after 1967. That isn't true of the current situation, where the pound continues to fluctuate in value in a free floating exchange rate system.
UK Pound value against US$ Jan 2016 to Jan 2017
As is clear from the path taken by the UK pound against the US$ there remain variations in value. This is partly because of changing business and consumer confidence as more news arises over the likely results of Brexit.

Therefore we should be looking for evidence of a J-curve effect, but remember we don't live in a world where one change is followed by stability of all variables that allow us to see the elegant relationship the textbooks tell us about. But it should be there, just partially obscured.


This topic is of specific interest to IB students for their international economics section of the course. However the effect of the changing value of a currency is equally important to VCE students as the fall in the exchange rate of the A$ since 2012 and especially since 2014 is highly significant.



Friday, 30 December 2016

The good side to exchange rate depreciation

The exchange rate of the UK Pound against other currencies has fallen considerably in 2016, the result of the vote to leave the EU. The cause of the fall is actually based on the view that the UK economy will do less well outside the EU than in it.

The chart shows the value of the pound against the US$ over 2016.


The pound has performed in a similar way against other currencies.

What does this mean? Firstly UK imports are more expensive because more pounds have to be given to buy each foreign good or service than before. This can lead to higher inflation as the price of imported goods and services in pounds rises and it makes UK consumers worse off.

On the plus side British exports are cheaper as far as foreigners are concerned. This will allow British firms to raise the level of exports. As long as the Marshall-Lerner conditions hold this will mean that the UK will experience rising net exports (X - M) and so a boost to Aggregate Demand and economic growth.

The article below explains how the British tourist industry is already experiencing a rise in demand and expects 2017 to be an exceptionally good year. A silver lining for Brexit?


This article is an excellent example for International Economics for IB and can equally be used to illustrate the effect of changing exchange rates for VCE students. Note the Marshall-Lerner conditions are only part if the IB syllabus.

Wednesday, 7 December 2016

Australia is not 'half way' to recession.

Yesterday it was revealed that in the September quarter the Australian economy shrank by 0.5%. Some commentators chose to say that Australia was 'half way to recession' on the basis of the semi-technical definition that a recession is two quarters of declining real GDP.

The fact that Australian GDP has fallen is remarkable and looking at the reasons for this is a very important exercise. There are many articles on the fall in. output that might make useful Macro IA's for the IB students.

The article below is from the Guardian Australia and as always has lots of data and opinion. The opinion makes it unsuitable for an IA article itself, but it can help you write a commentary.

What could be the causes of the fall in real GDP?
Falling AD?
AS not growing fast enough?

Certianly plenty to apply in this story to the AD/AS model.


See above - this is classic IA topic stuff. Causes, consequences and policy implications galore. For VCE students an absolute must to read as well.

Monday, 17 October 2016

Exchange rates as a shock absorber

Economies are subject to 'shocks'. Classic ones include the jump in the price of oil in the 1970's, the rise in commodity prices in the 2000's and the Gulf wars. When they occur there is an unexpected 'shock' to Aggregate Supply or Aggregate Demand (AD). This can result in inflation, unemployment or both in the domestic economy.

The diagram below shows the effect of a shock to AD, say the shock of Brexit to the UK economy reducing consumer and business confidence. This would reduce Consumption and Investment expenditure, shifting AD to the left.

One of the benefits that an economy with a floating exchange rate has in this situation is that the currency can depreciate and act as a 'shock absorber'. The shock of Brexit has led many to believe that the UK economy will perform less well in the future and this, they reason, will mean the UK currency, the pound, will be worth less as a result.

This has led to a lower demand to buy pounds and increased selling as people seek to hold their wealth in other currencies that are less likely to loose value. The falling pound (see two posts ago for that) has an important benefit for the UK economy. 

The lower value of the pound means that UK exports now cost less in foreign currency and import prices in the UK will rise. As a  result there will be a rise in the volume of exports and fall in the volume of imports (the law of demand). As long as the Marshall-Lerner conditions hold (and they will) this will mean a rise in the value of Net Exports (X - M) which is a component of Aggregate Demand. This will, at least partially, offset the fall in AD - absorbing part of the shock.

Many argue that this is exactly why the UK was wise not to join the Euro.


This is very much an IB post, and touches on macroeconomics and international trade. It is particularly useful as an example of the argument around single currency areas where asymmetric shocks are likely.

Wednesday, 6 April 2016

UK trade deficit

The UK has just recorded a record trade deficit on the Current Account. At 7% of GDP for the last quarter it is quite a large one.

The BBC article linked below describes what a trade deficit is and why running one might be a bad thing and when it can be coped with. Overall an excellent educational article on a current event.

I want to talk about why the trade deficit has widened and what it's implications are.

The UK economy grew in the last year. By 2.5% according to the latest data. That is actually quite high compared to the rest of the EU and other developed countries. As imports are a function of income economic growth means higher imports. (M = mY where M = total value of imports, m is the fraction of income spent on imports, known as the marginal propensity to import, and Y is Real GDP or national income.) So if a country grows faster than its trading partners it can expect its imports to grow faster than its exports.

The UK has recently seen a fall in the value of the Pound (a depreciation). This will make exports cheaper and imports more expensive so an improvement in the current account balance will follow if the Marshall-Lerner conditions are met. The chart below shows the UK pound against the US$.
The recent fall in the pound is seen clearly in the graph. So why has the UK current account not improved? The Marshall-Lerner conditions certainly apply to the UK. The answer lies in the J-Curve effect, the current account worsens before it improves because the UK Pound value of imports rise while the Pound value of exports remains the same after the depreciation.

We should also consider the impact on UK Aggregate Demand (AD). (X - M) is a component of AD and so this worsening current account will act as a drag on UK growth, at least until the J-Curve effect works through to an improvement in the Current Account deficit.


VCE students will find the article an excellent explanation of the significance of foreign debt. IB students will also understand the process of the depreciation of a currency and the application of both the Marshal Lerner conditions and J-Curve effect. All students should consider the impact of a larger Current Account deficit on the wider economy through AD/AS analysis.

Thursday, 3 March 2016

Growth in Australian economy 'not that bad'

Everyone knows that the mining boom is over. The non-mining sector is doing its best to save the economy from recession, but who actually gave it much hope?

Recent figures show that the Australian economy is growing much faster than we thought and 3% for 2015 isn't unreasonable. Of course this is at the lower end of Australia's growth target, but given the collapse of commodity prices and the decline in mining investment it is a nice surprise.

The Guardian have provided another excellent survey of economic data in the article linked below.

Notice that net exports are now a significant contributor to Australian growth. This is not from mining, but the non-mining sector. The depreciation of the Australian dollar has helped competitiveness and we are now seeing the 'J-curve' effect and confirmation that the Marshall-Lerner conditions apply.

Of course consumer spending (the largest contributor to GDP) and housing continue to be important. Should consumer sentiment drop there is still a danger of recession.

A good look through the data is advisable to all students, and you can play with the interactive graphs.


This article is essential reading for VCE Economics students. Understanding the influences on the Australian economy over the last four years (demand and supply side) is critical. For IB this article shows how a depreciation in the exchange rate has worked through to higher net exports as well as providing important examples for both Paper 1 and 2.

Tuesday, 26 January 2016

The falling oil price

The plummeting oil price is one of the major economic events that will affect the world economy in 2016. For students of economics it is impossible to ignore. (Note for Australian students the parallel with commodity prices should be obvious.)

The chart, from Tradingeconomics.com, shows the oil price for the last five years. The fall from $110 to $30 a barrel will impact the economies of every nation because oil is fundamental to the worlds energy supply. However the impact on each country is going to be different.

This is a huge subject and so today I will concentrate on Russia as an example, a major oil exporter.

It is fair to say that in the last twenty years oil and gas exports have allowed the Russian economy to expand and the standard of living of Russians has been improved due to this. In terms of macroeconomics Russia's net exports (X - M) has boosted Aggregate Demand (AD) and taxes on oil and gas (collected in a variety of ways) have funded a large proportion of Russia's government spending (G).

The fall in the oil price is disastrous for Russia. As net exports fall so does AD. The government finds that its revenue is falling and they must cut government expenditure to cope with their budget deficit, and so reduce AD further.

But the story is the exact opposite if you are an oil importer. Next exports will rise, as the cost of imports fall, shifting AD to the right. Also energy costs are an important part of firms costs and so AS moves to the right too.

So the result for Russia and other exporters, such as Venezuela, is a budget crisislower output, higher unemployment and possible deflation. Oil importers may see higher growth and employment.

There are other effects and considerations, not the least of which is the implication for exchange rates (see article).  For now we will leave it at the initial effects on the AD/AS model and a classic example of an 'asymmetric shock' - the same event affecting countries in opposite ways.


Questions:
1. What are the implications for the macroeconomic goals of Russia of the oil price fall.
2. How should Russia's economic policy mix change as a result?
3. What are the implications for the macroeconomic goals of non-oil producers of the oil price fall.
4. How should non-oil producers economic policy mix change as a result?
5. How can exchange rates help 'soften the blow' of the oil price shock?

This story is very applicable to IB with many avenues for an IA on trade and exchange rates as well as macroeconomics. If falling oil prices are chosen for an IA then students would be well advised to focus on just one aspect.
For VCE there are clearly lessons that can be applied to falling commodity prices.

Thursday, 6 March 2014

More good news!

Following on the growth figures it appears Australia is doing even better than thought.

Retail sales are growing strongly. This is more than good news for retailers and those who make the goods and services they sell. It suggests that Consumer Sentiment (consumer confidence) is very strong and this is good news for the national economy.

Households don't raise their spending when they are uncertain. When they are confident they spend and are prepared to borrow. This can lead to higher total (aggregate) consumption an important part of Aggregate Demand. Rising Aggregate Demand leads to higher growth and national income.

There is also news of a bigger than expected trade surplus - the amount that exports exceed imports. That means Australian firms are doing well in selling to overseas customers. Selling more means more jobs in Australia and that will help moderate the expected rise in unemployment.

Of course net exports (exports - imports) is also a part of Aggregate Demand. A larger trade surplus leads to a faster rise in AD and so faster growth.

Overall then the signs are that the slow down in growth caused by the winding down of the mining boom may be coming to an end. However the 'headwinds' causing the economy to slow remain strong, but the 'tailwinds' that speed the economy along seem to be getting a little stronger.
Australian Retail Sales - year on year change 2010 to present

Australia's Balance of Trade (Exports less Imports) 2011 to present