Showing posts with label Australian current account. Show all posts

Wednesday, 1 February 2017

Australia posts record Balance of Trade surplus

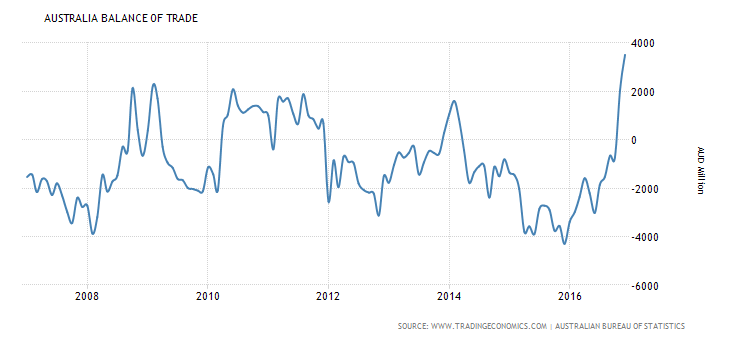
It is a matter of some celebration that Australia has achieved its largest Balance of Trade surplus ever in December 2016. This means that the value of exports in goods and services was greater than the value of imports of goods and services. As shown in the graph below this is unusual for Australia.


The main reason for the boost is that the price of commodities has risen and so have the volume of exports. So Australia has exported more and got more for what they have sold. Chinese demand is crucial in this process.

There are other reasons for the improvement, one being the increased competitiveness of Australian goods and services due to the lower value of the dollar in recent years. However it is mainly commodities and that really is down to China.

Don't get too excited because the Australian Current Account remains in deficit and has been since 1974. The Current Account includes the Balance of Trade, net income and transfers. This clearly implies that the deficit on income and transfers outweighs the Balance of Trade surplus. The graph below shows the Current Account balance for the last ten years to compare with the Balance of Trade above (note that the data for last three months are not yet available below).
There are always implications for of Current Account deficit, such as the effect on Aggregate Demand, a Financial Account surplus, rising foreign debt and the possibility that the country is uncompetitive. A 43 year Current Account deficit suggests the competitivness point has been settled.


This topic is a crucial one for VCE students who should consider the impact on Australia's Net Foreign Debt position and what it says about the country's dependence on China and commodities. IB students will equally be able to use it as an example of International Trade and the wider effects of deficits and surpluses.

Monday, 22 October 2012

Summary of Australian Economic data

Here is some data to remember for the VCE Economics exam.

Remember - the last four years only required and you need to look at TRENDS not the specific minor variations.

Growth has fluctuated over the period. In 2008/9 the primary influence was the GFC and the fall in demand from the rest of the world. The period feom 2010 is most strongly influenced by Chinese growth and the strength of the dollar. Currently growth is moderating and this is due to slower Chinese growth and falling commodity prices. Therefore Demand Side factors have dominated.


Unemployment rose at the onset of the GFC but then moderated to fluctuate a little around FULL EMPLOYMENT at 5%. The principle influences are demand side factors and immigration.

Employment has risen, quickly as the effects of the GFC were overcome and then very slowly since late 2010, but clearly on an upward trend. This suggests the small variations in unemployment are not major causes for concern.


Inflation has risen steadily, but the rate has moderated since mid 2011. The concerns about future growth (such as Chinese growth slowing) and the lower rate of inflation itself has allowed the RBA to lower interest rates. Remember that interest rates take up to two years to take their full effect on inflation so it could be argued that the RBA has acted too late.

Monetary policy does seem to have lagged behind changes in the inflation rate. Central banks try to keep 'ahead of the game' and we would expect to see interest rates falling before the rate of inflation turns up or down, not at the time as we see here. Low marks for the RBA on this one.

 The exchange rate is influenced by many factors, but in Australia's case the price and quantity of mineral exports and the relatively high Australian interest rates (The UK and USA have had rates of 0.5% for almost the whole period) have been the primary influences. The high exchange rates have made Australian exports less competative abroad, while it has raised the value of exports from the resources sector.

Australia has run a current account deficit since the mid 1970's. Adjusting the figures to a percentage of GDP gives the best indication of relative trade performance. The mineral resources boom has helped close the size of the deficit steadily, although Australia continues to run a deficit, meaning that foreign debt will inevitably rise.


However exteral debt has not risen much and as a proportion of GDP has increased hardly at all.


The budget has been in deficit and is currently in a contractionary stance.  The Government wants to return to surplus for reasons that are difficult to explain. Possibly they worry about the debt burden in the future.

Despite this clear upward trend Australia has one of the lowest public sector deficits and debts in the OECD. 

I hope these snapshots of the data will be useful.