There are going to be a lot of articles on protectionism (Trump) and access to markets (Brexit) coming up. The article below looks at whether free trade is good or bad. Handy points of evaluation to deploy on articles about trade that might be used for IA's.
Thursday, 19 January 2017
Tuesday, 17 January 2017
Effects of inflation
For those thinking of looking at rising inflation (say in the UK in December, reported yesterday) here is a little article on who wins and who loses from inflation. (Read stakeholders and evaluation!)
Thursday, 12 January 2017
Look out for the 'J curve'
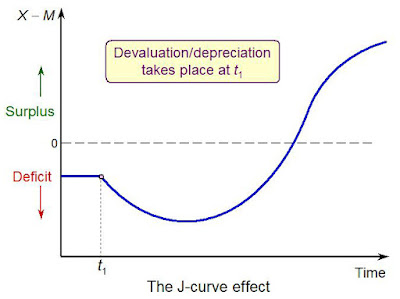
Economic theory tells us that when a countries currency depreciates (falls in value) that export prices fall, import prices rise and that following the law of demand the level of net exports, X - M, (the balance of trade or current account) will grow.
It's not quite as simple as that. Firstly it takes time for the change in export and import volumes to occur. At first they will stay the same. This means at first export values stay the same (valued in the country's currency) and import values rise (values in the country's currency). So the balance of trade, or current account or net exports at first gets worse.
Providing the Marshall-Lerner conditions hold over time exports grow as foreigners realize they are now cheaper and imports fall as domestic customers switch to home produced alternatives. Therefore the reaction of net exports should be to initially worsen, then improve, and when plotted against time this looks like a 'J'.

Following the Brexit vote the value of the British pound fell, up to 20%. Therefore we might expect to see a J-curve effect on the British trade balance.
The data does not yet show this clearly. One reason is that the effect from t1 in the diagram above to the point where the current account turns into a surplus is thought to be about a year and a half. As we are six months in to the process we should only have seen a worsening of the trade balance so far.

UK Balance of trade December 2015 to November 2016 (latest data available in Jan 17)
The data shows the initial worsening we would expect in the balance of trade after the late June vote and fall in the pounds value. This isn't a smooth J-curve though.
The reason that we don't see a textbook J-curve is because all variables don't stay the same. In 1967 the UK devalued the pound in a fixed exchange rate system from 1:US$2.8 to 1:US$2.4. And that rate remained fixed until 1971. Therefore there was certainty and stability in the exchange rate after 1967. That isn't true of the current situation, where the pound continues to fluctuate in value in a free floating exchange rate system.

UK Pound value against US$ Jan 2016 to Jan 2017
As is clear from the path taken by the UK pound against the US$ there remain variations in value. This is partly because of changing business and consumer confidence as more news arises over the likely results of Brexit.
Therefore we should be looking for evidence of a J-curve effect, but remember we don't live in a world where one change is followed by stability of all variables that allow us to see the elegant relationship the textbooks tell us about. But it should be there, just partially obscured.
This topic is of specific interest to IB students for their international economics section of the course. However the effect of the changing value of a currency is equally important to VCE students as the fall in the exchange rate of the A$ since 2012 and especially since 2014 is highly significant.
Wednesday, 4 January 2017
Are incentives irrelevant?
Finland has begun an experiment where it will pay unemployed citizens a fixed monthly sum. The idea is based on a 'universal basic income'. Other countries are going to start similar experiments.
The idea of a basic minimum income, regardless of economic activity, is one that is very attractive to those who are concerned with addressing inequality. It is controversial because opponents say it will simply encourage idleness.
Traditional supply side economic theory says that if the difference between in-work and out-of-work income is too small then there is too little incentive to take up job offers. People remain unemployed until a better offer comes along. When the difference is large then the unemployed jump at a job offer, therefore governments have cut the real value of the unemployment benefit sine the 1980's.
Supporters say that it is more important to deal with inequality which has risen continuously since the 1980s. This was not promised by supply side theory which said that the initial the rise in inequality would be reversed due to faster economic growth. (Unkindly some say this is the 'trickle down' effect, but actually they envisaged faster productivity growth and so higher wages throughout the economy.)
Others point to the fact that the system is very cheap to administer. There are no tests, no adjustments (even if the recipient finds work) and so minimal clerical effort. Therefore government expenditure is partly offset by lower costs of administration.
It's something you may want to watch.
The new VCE study design has downplayed the study of inequality. However at IB it is an important economic goal. There is an IA in this one that looks at the effects on LRAS and AD. Read the article carefully, I have not put in every important detail here.
Subscribe to:
Comments (Atom)