Sunday, 28 February 2016

Trade barriers in Africa are difficult to dismantle

The benefits of free trade are well known to economics students. When there is free trade production can be located where the law of comparative advantage dictates. Trade follows and in the long run everyone is better off.

The problem comes with the 'long run' part. Lots of people will be displaced from their current employment as comparative advantage does its work. They might be out of luck in moving into a country's expanding sector for its declining one. Politicians hate this as people who lose their job tend to blame governments.

Africa is one area where the benefits of free trade are yet to be fully realised. Despite a number of free trade and co-operative areas there are still significant barriers to trade. A favorite tactic is to replace lower tariff barriers with higher non-tariff barriers.

A non-tariff barrier is a regulation. For example a safety standard which means firms have to spend money to alter their product before it can be sold in the country. This raises the price and so favours local producers. There are many possible non-tariff barriers and bringing down one of them can lead to two more being set up.

The Economist covers moves to try to reduce Africa's trade barriers ans so encourage more intra-African trade. Presently Africa trades more with the rest of the world than it does internally. While this is partly down to poor infrastructure it is also due to high tariffs and other barriers to trade.

The Economist article is here

This article is of most use to IB Economics students who study trade in some depth. However VCE students can benefit from the application of trade theory and policy and its link to the standard of living.

Friday, 19 February 2016

Should there be a 'sugar tax'?

There is discussion around the world about putting a tax on sugar. In particular the sugar in fizzy drinks is causing concern with young people consuming so much sugar that it is leading to an obesity problem.

When people become overweight they are more susceptible to illness, such as heart disease. This leads to higher medical costs which are, in most countries, placed on governments and also leads to lower productivity. The economic problem is one of negative externalities in consumption.

The diagram below shows how negative externalities lead to a market failure in the consumption of sugar.


The demand curve (D) is also the Marginal Private Benefit Curve (MPB). The market equates supply and demand at P1, Q1. The problem is that households do not consider all of the costs of consuming all that sugar in the fizzy drinks. The Marginal Social Benefit of consuming sugar is less than the perceived private benefits.

This makes sugar a 'lack of information good' and the market oversupplies the good above the optimum amount (where MSC = MSB which defines allocative efficiency) by the amount Q1 - Q*.

So will the proposal to impose a tax on sugar work? The answer is that if the tax is of the right amount it will. In the diagram a tax of P* - P2 is imposed and the equilibrium quantity falls to the social optimum 0Q*.

There are difficulties. The BBC article suggests that is there is a 20% tax on fizzy drinks will reduce sugar consumption by 16%. That suggests demand is really quite inelastic. If the tax was on all sugar then it would be more effective. Another difficulty is that we actually don't know what the optimal consumption of sugar is, or the elasticity of demand, so the 'right' tax level is guess work.

A tax on sugar will reduce consumption, it will internalize the externality due to the information failure and provide revenue to help fund health services for those who need them. For economists it's a good solution.


This article is aimed at a level of difficulty that is most suited to IB Economics (and A level). However VCE students need not worry about the labels MPB and MSC,  simply that the demand curve does not include the true benefits of consuming the good.

Wednesday, 17 February 2016

Influences on the Australian Budget

The role of economic forecasts are crucial in setting a government Budget. As the Treasurer Scott Morrison approaches his first Budget he must consider what is likely to happen in the economy.

This is important because government revenue and spending are affected by the level of economic activity. When growth is slowing, or worse GDP declines, government revenues are lower than expected and government expenditure is higher. This has been the story in Australia since 2011.

The present government, and to an extent the last one, have an irrational (from an economists perspective) desire to achieve a Budget surplus. It would appear that they wish to cut spending to achieve this. However that is the exact opposite of what a government should do when growth is slowing and there is the threat of a recession.

The Committee for Economic Development of Australia (CEDA) have issued a report on the trends in the Australian economy. It makes gloomy reading for Morrison. There will be no strong growth in tax receipts and it would appear there is a good deal more structural unemployment to come.

Worst of all for the Treasurer there is a great deal of uncertainty over currency and commodity markets. Australia depends on commodity exports and the exchange rate will determine the value of those exports. It is likely that once again the Budget figures released in May will be substantially revised during the year.


This article is especially important to VCE Economics students who must have a firm understanding of events and influences on the Australian economy over the last four years. For both IB and VCE students the importance of forecasting to Budgetary/Fiscal policy is relevant as in the influence of the budget on the real economy.

Tuesday, 16 February 2016

Negative gearing - does it lower rents?

'Negative gearing' is a scheme in Australia where a landlord can make a loss renting out a property and set that loss against their other income so that they pay less tax. For example a landlord collects $100 a month less than the cost of a properties mortgage and expenses. The landlord earns $100 a month from other work, but pays no tax on that income in compensation for the loss. Only three countries in the world allow this and Australia is one of them.

The 'tax incentive' allows people who buy property as an investment to earn higher profits from that investment in the long term. It is widely criticized as causing a less equal distribution of income as the benefits go to those who can afford to own more than one property. There are a substantial number of investors who own multiple rental properties.

Those who defend the use of negative gearing claim that it helps lowers rents for those who cannot afford to buy their own home. This is because it allows landlords to rent at a loss.

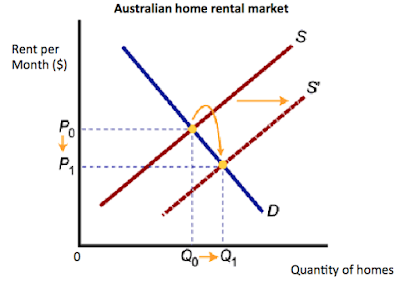
The economics of this can be explained using demand and supply.
Figure 1
Figure 1 shows that as the cost of buying a rental property is now lower, the supply curve of rental homes shifts to the right (S to S1). The market equilibrium rental price falls from 0P0 to 0P1, while Q1 - Q0 more homes are rented out at the new market rent, P1. It seems that renters share in the good fortune of the tax break given to investors.

The problem is this isn't really all that happens. It is a complex situation and we will focus just on the housing market. The fact that landlords can now recoup part of their loss on an investment means they can afford to pay more for any given property. This raises the demand for housing and, given that the stock of homes is very limited (inelastic supply), we can expect this to drive up the price of homes. Figure 2 shows how the effective subsidy for landlords shifts the demand for homes from D1 to D2, that leads to a rise in the price of homes to 0P1 from 0P0. The inelastic nature of house supply means that the price rise might be quite significant compared to the demand shift.

Figure 2

The result of this rise in the price of buying a new home means that landlords costs are higher than they would otherwise be, wiping out at least part of the gains from Figure 1 (S1 does not shift as far to the right). Further the higher price of buying a home means more families have to rent as they cannot afford to buy. So the demand for rented accommodation in Figure 1 shifts to the right, resulting in higher rents.

It is therefore not at all clear that negative gearing helps renters. It certainly reduces the tax bill of landlords however and that makes it difficult for weak politicians to tackle the problem. There is no doubt in my mind that negative gearing represents an unjustified transfer from taxpayers generally to landlords and helps skew the distribution of income towards the higher income deciles of Australian society.

The ABC explain why the scrapping of negative gearing wont push rents up and some of the history of the tax concession in the article below.


This article is relevant to VCE students for Unit 4, budgetary policy and for the goal of equity of income distribution. It is relevant to VCE and IB students as an application of supply and demand analysis using elasticity and an example of government failure in their intervention in a market.

Sunday, 14 February 2016

When market power corrupts

The free market allocates resources efficiently when it works properly. Unfortunately free markets can fail under certain circumstances and one of those is monopoly power. We can define monopoly power as the ability to influence both the price and quantity in a market.

A measure of monopoly power in the concentration ratio. This looks at the market share of the top three, four or five firms in an industry. The higher the share of the market the more power the top firms have.

The three firm concentration ratio for food retailing in Australia is 85%. Coles and Woolworth's have nearly 75% of the market between them (with IGA third). This gives Coles and Woolworth's monopoly power to some extent. (Note a pure monopoly is when a firm has 100% market share, but monopoly power is about the ability to influence customers and suppliers).

When a firm has monopoly power they can work against the best interests of consumers. They can raise prices and so earn higher profits at the expense of customers.

In the article below Woolworth's are accused of using excessive market power to raise profits by abusing their relationship with suppliers. (Technically monopsony power.)

When a firm has such large market share as Woolworth's it is essential for a supplier to have their product on the stores shelves. Imagine you go to Coles or Woolworth and the chocolate bar you wanted wasn't there. You probably buy an alternative that is there.

Woolworth are accused of demanding unfair terms and payments from suppliers in order to raise their profit. They abuse their market power by doing this and the Australian Competition and Consumer Commission (ACCC) are taking them to court.

While this is unusual in that market power is being exploited to reduce suppliers profits it is an excellent example of the work of the ACCC and monopoly power.


Questions:
1. Why does large market share give a firm monopoly power in a market even though the industry is actually an 'oligopoly'?
2. How does the action of Woolworth's act against the best interests of consumers?

This article is of critical importance to VCE Unit 3. It provides a recent example of the work of the ACCC and the abuse of monopoly power. For IB this is a useful example for the HL section on theory of the firm and policy to correct market failure.

Thursday, 11 February 2016

Anti-dumping measures, another crude attempt to resist efficiency?

Australia has decided to put an import tax (a tariff) on Italian canned tomatoes. Their argument that the Italians are pricing their product unfairly.

The one producer of canned tomatoes in Australia, SPC Ardmona, owned by Coca-cola Amatil, claim the Italian tomatoes are being 'dumped' on the Australian market.

The test Australia has applied is that Italian producers sell their product for less in Australia than they do at home. While this definition is seen a lot dumping is actually selling a good at less than the cost of production. Dumping is legal under World Trade Organization rules unless the foreign country can reliably show the negative effects of the exporting firm on the domestic producers.

It seems very unlikely that the Italians are making a loss. Italy's economy is in a perilous state and taking a long term loss just isn't an option.

So what might be the motive? A clue might come from one of the supporters of the move, 'The Australian Campaign'. This group argue that we should all buy Australian products in order to keep jobs in Australia. Never mind the quality or price.

In the short term such a strategy may work. However in the long run this policy would allow inefficient and uncompetitive firms to survive. Consumers will be much worse off as they pay higher prices and exports would dwindle as firms, protected from competition, could lose world market share. 

It is much better for jobs and prosperity to buy the most competitive goods, force domestic firms to compete or die and so allocate resources efficiently. It is very sad that protectionism continues to be given any credibility by such 'anti-dumping' actions,

In fact most anti-dumping tariffs last less than two years. They are withdrawn before the WTO can rule them as bogus.

The effect of the measure will raise profits and sales at SPC. The diagram shows this.
At present tomatoes sell for 60c a can. Total sales are 0Q2 with Q2 - Q1 being imported. Australian firms only produce 0Q1.

After the tariff the price rises to $1.40 a can and sales fall to 0Q4. Imports fall and domestic output rises to 0Q3. 

The problem is that the consumers lose out.The whole coloured area is lost consumer surplus. The green area represents inefficient production costs and the red area consumer surplus transferred to domestic producers (SPC).
This article is directly relevant to VCE Unit 4 on policy goals and example of trade policy. IB students will study this is Unit 3 on international trade. The diagram shows how to apply theory to a real life example.

Update: Rather good article here,published on 16th Feb.
The Drum article is here

Tuesday, 9 February 2016

Deamnd and supply and the oil price

As every Economics students know market prices are determined by demand and supply. The price of oil is no different.

Since July 2014 crude oil prices have fallen from $116 a barrel to a low of $28.
Many have suggested that the oil price is about to climb again, but the International Energy Agency (IEA) has said that demand and supply factors don't support that. (Shout out to my old friend Trevor Morgan, the principal author of the IEA report.)

The article below provides some detail, but in brief the IEA don't see demand climbing and believe supply in 2016 will actually be higher than in 2015. With oil stocks rising at 2 million barrels a day at present this already suggests that the market equilibrium price is still higher than the market clearing price.


Questions.
1. Draw a demand and supply diagram to show the current state of the oil market as described by the IEA.
2. Draw a supply diagram for the oil market showing the change that the IEA predicts will occur over 2016. (Use a 2015 and 2016 label on two demand curves and two supply curves). Describe and explain the new equilibrium in the oil market by the end of 2016.

This is an article that describes a fundamental concept for all Economics students. IB students might consider it for a microeconomics IA.

Monday, 8 February 2016

China uses up US$100 billion of foreign reserves in a month

Exchange rates are generally set by the foreign exchange market. The demand and supply of a currency in the market determines it's price, just like any good or service.

Some countries choose to fix their exchange rates, but they are usually small countries which need the stability of a stronger, low inflation currency.

China has never favoured freely floating exchange rates, but they don't like official fixing the value of the currency either. However China has generally sought to keep the Yuan at a level that assists Chinese competitiveness.
The chart, from Trandingeconomics.com shows how the Yuan steadily appreciated until the mid-90's. Then China intervened more strongly to maintain a fixed exchange rate and prevent Chinese exports becoming too expensive. (Note periods of earlier intervention.)

The fundamental economic indicators for China from 1995 until recently were very strong. Double digit growth led most to conclude China was the place to invest and China didn't disappoint them. Today Chinese growth is slowing and they have to cope with inflation, a novel problem for them. Some are looking elsewhere for opportunities.

So capital is now leaving China, the trade surplus is getting smaller and, as economic theory would predict, the exchange rate is falling.

China has responded by trying to maintain the exchange rate. There are three ways of 'managing' a floating exchange rate (sometimes called a dirty float).
1. Raise interest rates
2. Buy your currency of the foreign exchange market using foreign currency.
3. Talk your currency up.

China has been using option two. And they have a lot of foreign money in reserve to do this (Over US$3 trillion). Years of huge trade surpluses have allowed China to build up this substantial stock of foreign currency.

Can they really carry on spending US$100bn a month to maintain the Yuan's exchange rate? The answer is no. The article from Forbes below provides valuable details and suggests that China can only afford to spend about a third of their reserves - that means at this rate they have no more than a year before fundamental economic forces get their way with the Yuan.


How the foreign exchange market works is part of VCE and IB. This particular story is especially useful to IB students and they should be able to explain how exchange rates are set and how intervention in the market works using demand and supply analysis. There are many articles on this topic suitable for use in an IA.

Thursday, 4 February 2016

Trans Pacific Partnership deal signed - what does it mean?

The Trans Pacific Partnership (TPP) was signed in New Zealand on Thursday. It creates a free trade area that accounts for 40% of world trade and 800 million people.

Economists know that when trade barriers are reduced there will be more specialisation, more trade and higher real income. On the whole people will become better off. So why are there so many protests against the PTT?

The problem with removing protection from domestic industries (by removing tariffs in the case of the PTT) is that expensive domestic production is replaced by cheaper overseas production (known as trade creation). This is good for consumers, but bad for workers who earn their living in the previously protected sectors. While overall society is better off the pain of the deal is concentrated on a few.

There will be some losers outside of the TPP. Those who now find themselves uncompetitive because they continue to pay tariffs on their exports to TPP members. This 'trade diversion' is, according to studies, quite small.

The TPP is a significant change to world trade. The BBC page below links to a number of others that explore the new Free Trade Area, which includes Australia. The winners and losers are explained and the details of the deal are explored.


This story is relevant to both IB and VCE Economics. 

VCE students should look at this and be able to explain the pros and cons of the deal and be able to explain how it will affect the standard of living in Australia.

IB students should be able to apply the theory of trade to the TPP. There are numerous opportunities to find good IA source material.

Wednesday, 3 February 2016

Australian dollar strength - just a short term improvement?

Exchange rates movements are very difficult to predict. The reason is that there are many short term influences that cause volatility and long term influences that determine a  'fundamental value' for a currency.

This week the Australian dollar has strengthened against the US dollar (US$). A relief for the many Australian travellers abroad? Maybe not. All currencies have got stronger against the US$ so Australians will only see a real difference if visiting the US itself.

In the short run the demand and supply of currencies is influenced by a number of factors, which can change quickly, such as commodity prices and interest rates. Once the market takes the view that a currency's value will change the speculative forces that are brought to bear make that change inevitable - at least for a while.

In the long run the theory of 'purchasing power parity' suggests that a currency's exchange value should reflect how many real goods and services will actually buy and the rate moves to equate that purchasing power. So the long run trend is set and the short run variations move around that.

If the theory of purchasing power parity applies to Australia then with the end of the mining boom Australia's dollar should have depreciated against other currencies since 2012. This is because Australians will be worse off as a nation.

The article from The Age looks at some of the recent influences on the Australian dollar. An excellent case study in demand and supply factors affecting exchange rates.


This article has particular relevance to IB students  for exchange rates and is a possible IA article  For VCE students the article also provides essential reading on the influence of the exchange rates of economic goals and the standard of living.

Tuesday, 2 February 2016

Applying Opportunitiy Cost

The central problem of economics is scarcity. There are finite resources in the world, but infinite wants. This means that all societies must make a choice about how to allocate resources.

Opportunity cost is the real cost of making a choice on how to allocate resources. It is defined as 'the next best alternative forgone' and is a vital concept to understand in the first week of any economics course.

The trick is to apply the concept to the real world. Below are links to two articles from recent days. They look at two examples of applying opportunity cost.

The first is about decisions made by Britain's National Health Service (NHS) on which cancer drugs to pay for. Britain's health service is funded through taxation and is 'free at the point of use'. The problem is it has a fixed budget from the government and so the NHS must decide which treatments to fund. The NHS is left with the unpleasant fact that when they choose one treatment they can't fund another and some people go untreated. (Actually they get other less effective drugs or palliative care.)

The second article looks at the dilemma of an American Football Club which also has a fixed budget. They must decide which players to hire/retain. If they pay one player a great deal of money then they can't hire or retain a number of other players.

Read the articles and answer the questions below.


Questions:

1. Identify all the examples of scarcity and opportunity cost in the articles
2. Using examples from the articles explain how there is always an opportunity cost for any choice.

This post is relevant to all students of economics.

Monday, 1 February 2016

Which economic goal is most important?

One thing that you should learn from economics is that it's about choice. No matter what you look at there is a need to trade-off one goal for another.

This is true of macroeconomic goals. It isn't possible to have inflation, unemployment, economic growth, the Current Account and income distribution all exactly as you want. To improve one another inevitably gets worse.

In the 1940's it was decided that unemployment had to be the number one priority of government macroeconomic policy. Hardly surprising given the experience of the Great Depression (1930 - 33) which saw unemployment reach 25% or even more.

By the 1980's it was generally agreed that inflation needed to be the main priority. This change was, again, brought about through bitter experience. It was argued that if you got the price level stable then it was easier to achieve the other economic goals.

Below is an excellent article from The Guardian that explains why low inflation is beneficial and credits Australia's economic success over the last thirty years to a low inflation environment.


The chart shows how inflation in Australia since the 1980's has been lower and less volatile than in the period immediately before 

This article is directly relevant to VCE students who must understand the goals of macroeconomic policy and the policy mix needed to achieve them. For IB students it is an excellent explanation of why achieveing price stability is important.